Introduction: Beyond the Paycheck – Conflating Income and Wealth
In contemporary discourses on economic inequality, the terms “income” and “wealth” are frequently used interchangeably, although technically they refer to very different things.
This is not merely a semantic issue; it obscures fundamental distinctions that are critical for understanding the persistent, generational nature of economic stratification. The failure to differentiate between these two concepts hinders the ability to diagnose the true scale of inequality and to design effective policies to address it (Atkinson, 1970).
It is essential to begin with precise definitions, as used in economic analysis and by bodies like the World Inequality Database (WID) (World Inequality Database, n.d.).
Income is a flow variable. It represents the amount of new value generated from an individual’s productive assets over a period of time, typically a month or a year. This includes wages earned from labour, rent received from property, dividends from stocks, or profits from a business. If an individual’s only asset is their ability to work, their wages in a time period is their income. If an individual does not work, but instead earns remuneration from leasing out a house that they own, the remuneration in a time period is their income and the house is their productive asset. Earnings from stocks and shares could also be productive assets, and when dividends are generated over a fixed time period, it is income for the individual who owns them. Because it is tied to current economic activity, income can be volatile, fluctuating with market conditions, employment status, or exogenous shocks like a global pandemic.
Wealth, conversely, is a stock variable. It is the accumulated value of all assets owned by an individual or household at a specific point in time. As defined by the WID, household net wealth includes all non-financial assets (e.g., real estate) and financial assets (e.g., stocks, bonds, pensions), net of all debts. It is what you own, not what you earn.
Wealth distributions are a result of accumulation, often over generations. This accumulation process is influenced by factors such as inheritance (the house that the individual owns, was it their own acquisition, or was it handed down?), savings rates (how much of their income was put away for acquisition of assets?), and investment returns (how much are the stocks and shares increasing in value over time?). All of these tend to grow in a relatively stable manner over time, imprinting an inertial characteristic to individual wealth, and wealth distributions as a whole.
While income inequality is a significant and widely discussed problem, it is wealth inequality that represents the more entrenched, structural, and generational challenge. Wealth is the accumulation of income saved over time, combined with the appreciation of assets and the intergenerational transfer of those assets. An analysis of net personal wealth distributions from 2017, comparing the four countries in our project (i.e., South Africa, Brazil, Germany, and the United Kingdom), provides a stark snapshot of this global wealth chasm.
The Challenge of Seeing Clearly: Why Wealth is So Hard to Measure
Before examining the data, it is crucial to understand why the distinction between income and wealth is so often blurred in public debate. A primary reason is that income is far easier to measure. Wealth, by contrast, is notoriously difficult to capture accurately (Saez, 2017).
The empirical study of wealth inequality is still in its infancy precisely because the data is so difficult to obtain (Bourguignon et al., 2005; Saez, 2017; Zucman, 2019). Researchers face significant methodological hurdles that inherently lead to an underestimation of the problem:
Survey Data Limitations: The most common data source is household surveys, such as the German Socio-Economic Panel (SOEP) or the UK's Wealth and Assets Survey. These surveys have two fundamental weaknesses. First, they fail to capture a significant number of very wealthy individuals, as High Net Worth Individuals (HNWI) are a tiny fraction of the population and are “significantly less likely to participate”; second, even when they do participate, surveys often fail to account for the “complex forms of wealth holdings” (e.g., unlisted firms, trusts) and are subject to under-reporting of wealth (Cowell, 2006; Lustig, 2020; Zucman, 2019).
Administrative Data Challenges: The “ideal” data would come from population-wide administrative wealth registries, such as those used for wealth taxes. However, most countries, including the UK, Brazil, and South Africa, do not have a comprehensive wealth tax. Even in countries that do have wealth taxes, these registries are often incomplete. HNWI have been documented to use instruments to both hide their assets, and limit declared liabilities. This “missing wealth of nations” means that official administrative data often misses a significant portion of the very top (Zucman, 2019).
Indirect Measurement: In the absence of such “ideal” data, economists must rely on indirect methods. The Estate Multiplier Method infers the wealth distribution amongst the living from the inheritance taxes of the deceased, but this is complicated by variable life expectancies and tax avoidance. The Capitalising Incomes Method infers the wealth stock by observing the capital income flows (like dividends and interest) reported on tax returns, but this relies on broad assumptions about the rate of return (Zucman, 2019).
This methodological fog is not just a technical problem; it is a political one. It has allowed the public debate to focus on top incomes as a proxy for wealth, but as the data shows, this misses the scale of the underlying stock of accumulated capital.
Europe's Contested Laboratory: The Wealth Tax in Practice
These methodological challenges are not just academic; they are the central, real-world problems that have defined the contentious European (and broader global) debate on wealth taxes (Alderman, 2025; Cohen, 2025; Inman, 2024; Walt, 2025). The varied approaches in France, Switzerland, and Norway illustrate the political difficulty of answering who and what to tax.
France: Narrowing the Base: France provides a clear example of policy retreating in the face of these challenges. In 2018, it abolished its long-standing broad-based net wealth tax (Impôt de solidarité sur la fortune - ISF) and replaced it with a tax on real estate wealth only (Impôt sur la Fortune Immobilière - IFI). This new tax applies only to net real estate assets valued over €1.3 million. This shift was part of a broader reform to encourage investment in "productive" assets (like stocks and businesses) by untaxing them, while targeting the immobile asset class of property. It was, in effect, a concession that taxing mobile financial wealth was too complex and potentially damaging to investment (Cosnard, 2025; Ledsom, 2020; Walt, 2025).
Switzerland: Decentralization and Competition: Switzerland, in contrast, maintains a broad-based net wealth tax, which is levied at the cantonal (state) level, not the federal one. This decentralized system has made it the country with the highest wealth tax revenue in the world as a share of total taxation (5.6%). The tax is highly progressive, with the wealthiest 5% paying 87% of the revenues. However, this system creates intense tax competition between cantons, illustrative of the threat of capital flight. In 2025, for instance, the Canton of Geneva is actively cutting its income tax rates specifically to "stop wealthy taxpayers from moving away" to other, lower-tax cantons (Baselgia, 2023; Brülhart et al., 2016; KPMG, 2025).
Norway: Taxing Broader... and the "Exodus" Narrative: Norway is one of the few European nations left with a robust national net wealth tax. Crucially, its policy answers "who pays" very differently than in Switzerland. The thresholds are relatively low, starting around €150,000 (NOK 1.7 million), which results in approximately 20% of the adult population paying it. This makes it a much broader-based tax than a “millionaire's tax.” This policy has become the subject of intense international media debate, with widespread reports of an “exodus” of the super-rich, noting over 300 multimillionaires and billionaires had left by 2024. However, the data shows that revenue from the tax is increasing. The government has defended the policy on social contract grounds, with one official stating, “If you have enjoyed success and become rich in Norway, we hope you will stay... everyone should contribute relevant to ability”. (AFP, 2025; Inman, 2024; Neate, 2023)
These cases highlight the complexities involved in wealth tax implementation. This is because one needs to identify who the tax burden will fall upon, before one can design optimal policies: how do you define the tax base (all wealth vs. real estate)? Who pays (the top 1% or the top 20%)? And how do you manage the real or perceived threat of capital flight?
A Tale of Four Economies: Wealth Stock in Our Sites of Study
We use data from the World Inequality Database for our illustrations below. The 2017 wealth distribution data from our project’s sites of study, expressed in constant 2024 USD PPP, cuts through this fog. It reveals not just quantitative gaps but structurally divergent economies. An examination of the distributions from the bottom, middle, and top illustrates this divide (World Inequality Database, n.d.).
The Debt Floor (Percentiles p0-p20)
At the very bottom of the distribution, the data shows large negative net wealth for the poorest 10% of the population (p0-p10) across all four countries. However, the scale and context of this debt differ profoundly:
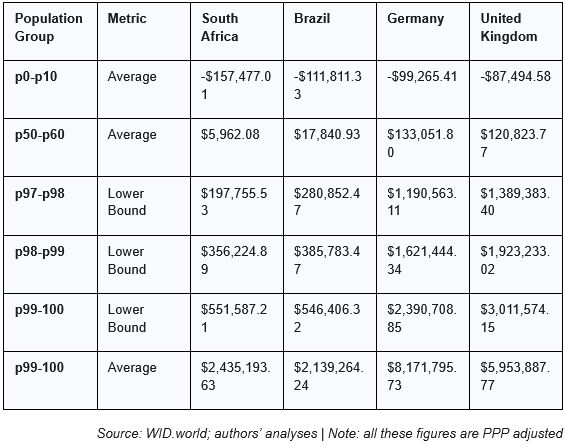
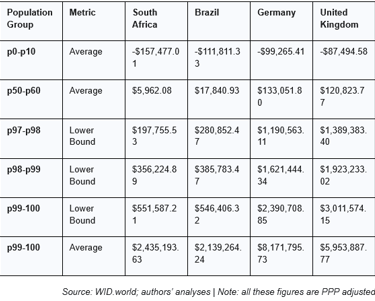
South Africa: Average wealth for the p0-p10 group is -$157,477
Brazil: Average wealth for the p0-p10 group is -$111,811
Germany: Average wealth for the p0-p10 group is -$99,265
United Kingdom: Average wealth for the p0-p10 group is -$87,494
This data highlights a qualitative distinction. In Germany and the United Kingdom, where median (p50-p60) average wealth is $133,052 and $120,824, respectively, a negative position of ~$90,000 for the bottom decile can plausibly represent productive, asset-backed leverage. This could be a mortgage on a property that is itself a large asset, or a student loan investing in human capital.
In stark contrast, in South Africa, where median (p50-p60) average wealth is a mere $5,962, an average debt of -$157,477 for the bottom decile cannot represent the same phenomenon. It points to a structurally different reality: a severe debt trap. This debt is likely composed of high-interest, unsecured consumer debt, which is extractive rather than productive, held by a population with virtually no asset buffer.
The "Missing" Middle (Percentiles p40-p70)
This structural divergence is most apparent in the middle of the distribution. The average wealth for the median population group (p50-p60) reveals the absence of a stable, asset-holding middle class in South Africa and Brazil compared to their European counterparts:
South Africa: Average wealth for the p50-p60 group is $5,962
Brazil: Average wealth for the p50-p60 group is $17,841
Germany: Average wealth for the p50-p60 group is $133,052
United Kingdom: Average wealth for the p50-p60 group is $120,824
The median German citizen possesses over 22 times the net wealth of the median South African. The German and UK data show a clear progression, with the population entering six-figure average wealth by the 50th percentile, forming the bedrock of a stable, consumer-driven economy. In South Africa and Brazil, the same percentiles hold wealth levels that are orders of magnitude smaller. This is not a “middle class” in the same economic sense, but rather a “fragile-positive” group, potentially just one economic shock away from returning to a state of net debt. This bears strong implications for social stability and the potential for domestic economic growth, which, especially in emergent economies, relies on strong demand driven by a robust consumer base.
Mapping the Top (Percentiles p90-p100)
The top of the distribution shows that the elite in South Africa and Brazil possess significant wealth by their own national standards, but the scale of that wealth is overshadowed by the top percentiles in Germany and the UK.
Consider the entry thresholds (lower bounds) for the top percentiles:
An individual with a net wealth of $356,225 would be in the top 2% (p98-p99) in South Africa.
An individual with a net wealth of $385,783 would be in the top 2% (p98-p99) in Brazil.
Where would that same ~$370,000 place them in Germany or the UK?
In Germany, the p80-p90 group has a lower bound of $367,589.
In the United Kingdom, the p80-p90 group has a lower bound of $351,733.
This demonstrates the difference between being “locally rich” and “globally wealthy.” An individual at the 98th percentile in South Africa or Brazil would be just entering the 80th percentile in Germany or the UK—part of the upper-middle class, but not at the extreme top.
To even enter the top 1% (p99-100) in Germany or the UK requires a net personal wealth of $2.39 million and $3.01 million, respectively. This is more than four to five times the entry threshold for the top 1% in South Africa ($551,587) and Brazil ($546,406). This implies that the true plutocracy within South Africa and Brazil—such as those possessing the average wealth of the top 1% ($2.44 million in SA, $2.14 million in BR)—are extreme outliers even within their own elite percentile.
Table 1: Comparative Net Personal Wealth Distribution (2017, Constant 2024 USD PPP)
The 'Stickiness' of Stock: Why Wealth Persists
While the 2017 data provides a static snapshot of this global “chasm”, another aspect of wealth distributions that needs to be understood is why they are so stable. The answer lies in the fundamental nature of wealth as a stock. Unlike income, which must be earned anew each year, wealth persists and compounds.
Wealth distributions are the result of accumulation, often over generations. This accumulation process is influenced by three core factors that create an inertial characteristic, making wealth distributions inherently “sticky”:
Inheritance: Intergenerational transfers provide a “crucial head start”. An individual’s starting position in the wealth distribution is often determined more by birth than by their own income-generating merit. This perpetuates advantages and disadvantages across generations (Stiglitz, 1969, 2015).
Differential Savings Rates: The capacity to save is, itself, a function of wealth. Lower-wealth households must dedicate most of their resources to consumption, leaving little surplus. High-wealth households, by contrast, can save large fractions of both their labour income and, more significantly, the passive income derived from their existing capital (stocks, bonds, business equity) (Piketty, 2014).
The Rate of Return on Capital: The simple arithmetic of compounding ensures that wealth begets more wealth. An asset base generates returns, which, when reinvested, expands that asset base, which in turn generates even greater returns (Piketty, 2014).
Concluding Remarks
The empirical divide visible in the 2017 data is not an outlier, nor is it temporary. It is the logical outcome of a system where wealth, as a stock, is inherently "sticky". The dynamics of accumulation—inheritance, savings, and returns—ensure that the chasm between the debt-laden bottom, the fragile-positive middle, and the compounding top is not self-correcting.
This persistence, however, is not passive. As the next post in this series will explore, the “stickiness” of wealth is the result of powerful, active, and self-reinforcing feedback loops that are embedded in our economic and political systems, actively concentrating capital at the very top. Understanding these dynamics should be the first step toward addressing it.
References
AFP. 2025, October 23. How Norway’s wealth tax drove out the rich without breaking the bank. The Local Norway. https://www.thelocal.no/20251023/how-norways-wealth-tax-drove-out-the-rich-without-breaking-the-bank
Alderman, L. 2025, September 18. ‘Tax the Rich,’ French Protesters Cry, as the Wealthy Push Back on Paying More. The New York Times. https://www.nytimes.com/2025/09/18/business/france-tax-protest-gabriel-zucman-billionaires.html
Atkinson, A. B. 1970. On the Measurement of Inequality. Journal of Economic Theory, 2, 244–263.
Baselgia, E. 2023. The Compliance Effects of the Automatic Exchange of Information: Evidence from the Swiss Tax Amnesty. EU Tax Observatory Working Paper, 19. https://doi.org/10.2139/ssrn.5109959
Bourguignon, F., Ferreira, F. H. G., & Lustig, N.Eds. 2005. The microeconomics of income distribution dynamics in East Asia and Latin America 1.ed. World Bank [u.a.].
Brülhart, M., Gruber, J., Krapf, M., & Schmidheiny, K. 2016. Taxing Wealth: Evidence from Switzerland. NBER Working Paper Series, 22376. www.nber.org/papers/w22376
Cohen, P. 2025, October 31. Are Wealth Taxes the Best Way to Tax the Ultra Rich? The New York Times. https://www.nytimes.com/2025/10/31/business/economy/wealth-tax-france.html
Cosnard, D. 2025, November 2. France’s new ‘unproductive wealth’ tax reflects a limited adjustment. Le Monde. https://www.lemonde.fr/en/politics/article/2025/11/02/france-s-new-unproductive-wealth-tax-reflects-a-limited-adjustment_6747019_5.html
Cowell, F. A. 2006. Inequality Measurement. London School of Economics.
Inman, P. 2024, August 12. No more fiscal favours? Calls to tax super-rich gain traction around world. The Guardian. https://www.theguardian.com/news/article/2024/aug/12/no-more-fiscal-favours-calls-to-tax-super-rich-gain-traction-around-world
Ledsom, A. 2020, October 9. France’s Rich Get Much Richer After Abolition Of Wealth Tax. Forbes. https://www.forbes.com/sites/alexledsom/2020/10/09/frances-rich-get-much-richer-after-abolition-of-wealth-tax/
Lustig, N. 2020. The “Missing Rich” in Household Surveys: Causes and Correction Approaches. SocArXiv. https://doi.org/10.31235/osf.io/j23pn
Neate, R. 2023, April 10. Super-rich abandoning Norway at record rate as wealth tax rises slightly. The Guardian. https://www.theguardian.com/world/2023/apr/10/super-rich-abandoning-norway-at-record-rate-as-wealth-tax-rises-slightly
Piketty, T. 2014. Capital in the Twenty-First Century A. Goldhammer, Trans. Harvard University Press.
Saez, E. 2017. Income and Wealth Inequality: Evidence and Policy Implications. Contemporary Economic Policy, 351, 7–25. https://doi.org/10.1111/coep.12210
Stiglitz, J. E. 1969. Distribution of Income and Wealth Among Individuals. Econometrica : Journal of the Econometric Society, 373, 382–397.
Stiglitz, J. E. 2015. Income and Wealth among individuals Part I: The Wealth Residual. NBER Working Paper Series, 21189.
Walt, V. 2025, September 15. The Wealth Tax Plans That Are Roiling New York and Paris. The New York Times. https://www.nytimes.com/2025/09/15/business/dealbook/wealth-tax-new-york-mamdani.html
Zucman, G. 2019. Global Wealth Inequality. Annual Review of Economics, 11, 109–138. https://doi.org/doi.org/10.1146/annurev-economics080218-025852
The Great Divide
Why Wealth, Not Income, Defines the Economic Chasm
By Ranchhod, V. and Jana, A.
SALDRU, University of Cape Town
7 November 2025

Politicians and Wealth Reproduction
An international and interdisciplinary research project about politicians, policies and the reproduction of wealth